Data Visualization
A wide range of out of the box Visualizations can be applied to view your data
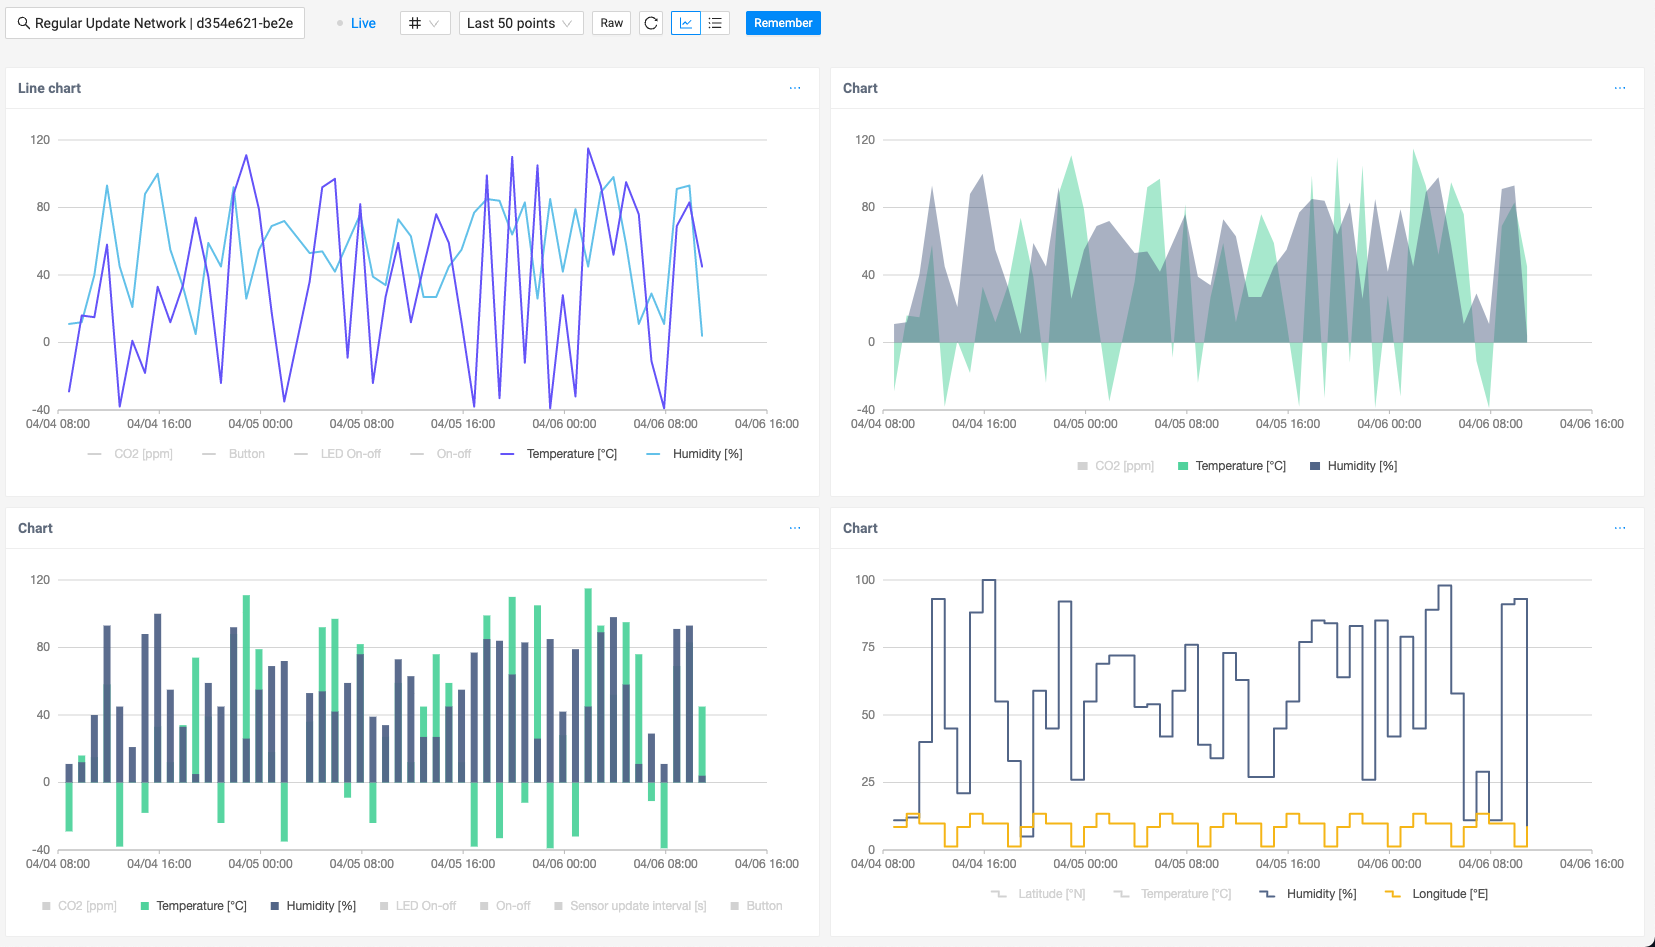
Fully configurable charts
You can efficiently monitor your data in different ways using fully configurable graph views, where you can explore your data freely.
Filtered lists and tables
Filter your devices based on configurable parameters and view them in lists or in the map.
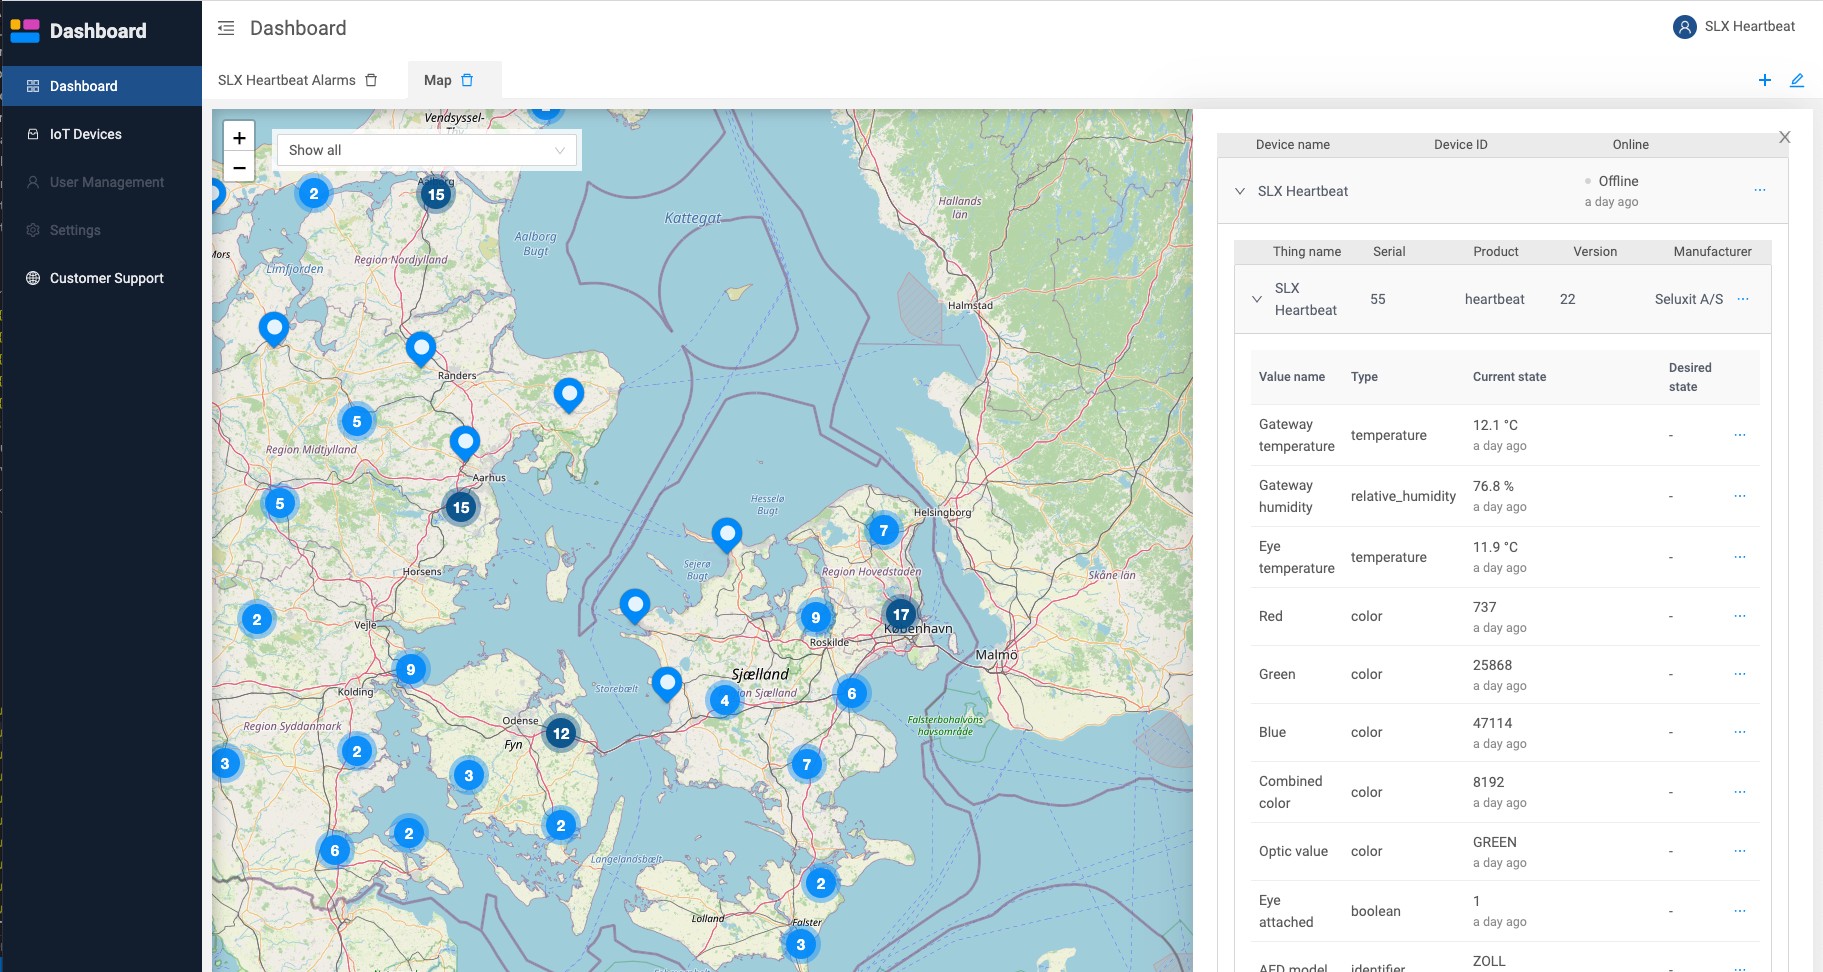
Geolocation support
You can choose to view your device on the maps that display their current or historical location.


